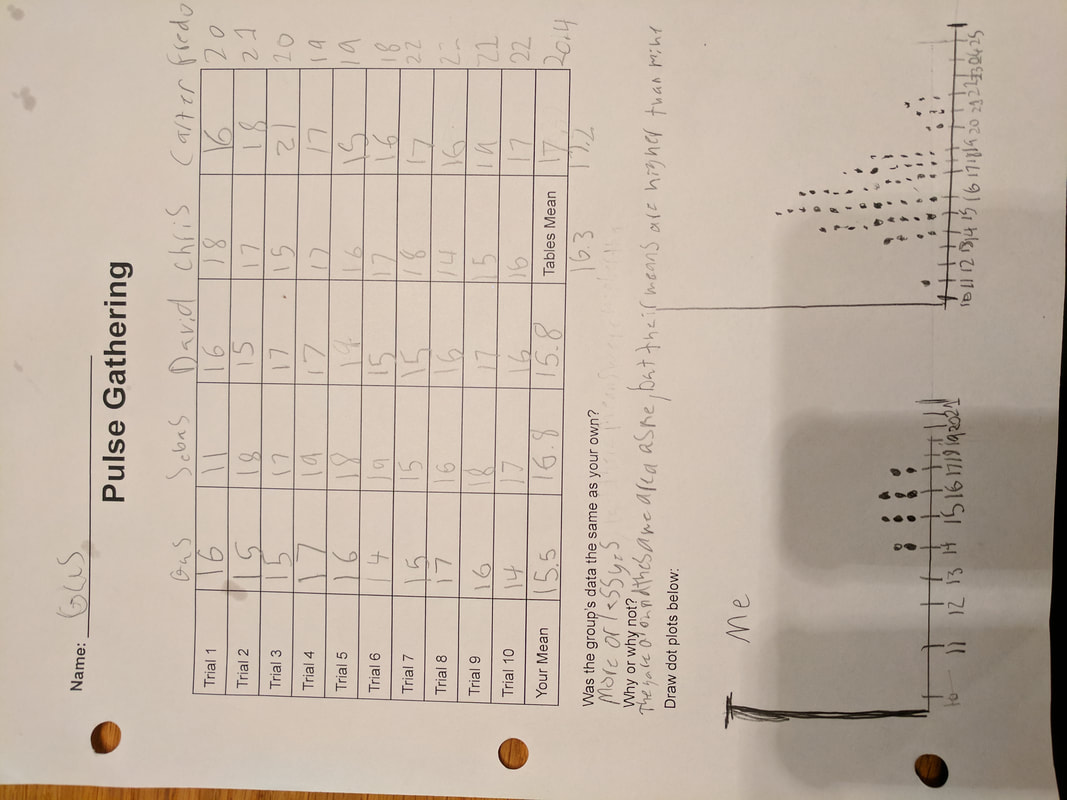
pulse Analysing/gathering
For this part of the project, we worked in our table groups to calculate our pulses. We found the mean/average of our pulse for 20 seconds and then worked with dot plots. We then were able to see the standard deviation in our dot plots, which was super cool. The class average Pulse was 64 BPM. Overall, I really enjoyed collaboration in this project, while learning about dot plots and mean/median/mode.